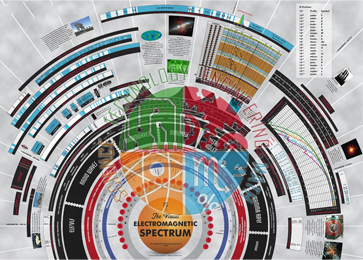
Quick Answer:The Electromagnetic Spectrum Chart is a visual aid showing how the wavelength and frequency scales of the electromagnetic spectrum compare, from radio and microwave uses to x-ray and gamma ray absorption. It comes with an explanatory sheet.
Last updated: 18 October 2026
Key Features
Compares wavelength and frequency scales across the spectrum.
Covers radio and microwave usage and x-ray and gamma ray absorption.
Accompanied by an explanatory sheet.
Supplied with: Explanatory sheet
How It Is Used
Displayed in the classroom, the chart helps students relate the parts of the electromagnetic spectrum to one another and to their everyday uses and absorption.
Laboratories and education suppliers in Peru, South Korea, Australia, Malawi and Eswatini can source the Electromagnetic Spectrum Chart from JLab India for export.
For a quotation on the Electromagnetic Spectrum Chart, contact JLab India on +91-8569909696.



.jpg)

